How to Find Out How a Blog Performs Over Time

Why would you want to find out how a blog performs over time? You want to see whether you made some progress.
Maybe your blog is even stagnating?
You need to know whether it gains traction on social media and how the visitor numbers develop as well. How can you do it?
Like Analytics Tools but Better
Most analytics tools save data over long periods of time. Google Analytics does. Yet it’s difficult to use by now and cluttered.
You can take the GA data and view it elsewhere.
I use a simple but powerful web analytics tool to find out how a blog performed over time: Databox.
It’s a modern dashboard combining your social media activity and site metrics for a quick performance overview.
Social Media vs Your Site
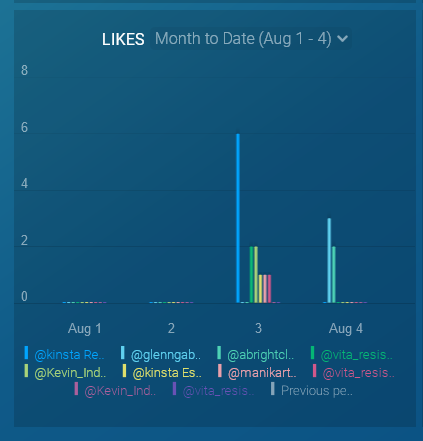
Databox monitors and analyzes the performance of your social media accounts and your traffic at once. You can compare the graphs and
see whether your social media activity had some positive impact on your visitor numbers.
You can also compare this year with last year, this month with last month etc. just like with conventional analytics tools but here’s it’s easier.
You also get automated reports sent per mail
that do it for you by default. I like the quick overview of my activity and how it compare to past periods of time.
The best thing about Databox is that it’s free to some extent or freemium There are additional paid features of course.
One Tool is More Than Enough
Of course there are numerous other tools but I’m quite tired of all these 101 resources lists.
In many cases you just need a few or sometimes only one. Databox is perfectly enough to follow key metrics.
Sometimes I do not even have the time to digest the wealth of data it offers regularly.
You do not even have to set up separate tracking for Databox. You just plug in your social media accounts and your Google Analytics so that your existing data can get used. I love it.

I didn’t know about any of these. Thanks for the recommendations. I’m with you on the crazy-long lists being counterproductive (although they make great linkbait).
thanks for the advice
the more analytical tools we have the better for decided which direction to with our marketing!
Hey Michael, glad I could help you. By now I can learn more from you again than you from me I think.
Traffic2mypage.com: You’re welcome. Please use a name, not only an URL or keywords for commenting.
thanks for the tool suggestions. im checking them out now. :-)
really nice tools!! thank you for your suggestions
Very cool to be included in this list – thank you!
I think you’re spot on – we’ve been seeing a lot of blogger interest in our functionality. Both to see how folks’ own sites do over time, and, as noted, to potentially monitor how other sites of interest are doing.
In monitoring content “performance”, AideRSS can really help in determining what topics or themes resonate with readers, and what demographics you’re attracting, which allows you to better craft/target your posts.
We’re working on some new tools, too, that will offer even richer metrics assessment for publishers. Stay tuned!
Excellentpost and very useful tools. Thanks for sharing
Thanks Melanie for showing up here. AideRSS is a great tool indeed. Now that I have your attention would be willing to listen to some sugesstions, feature requests?
Without StumbleUpon your overview is basically incomplete!
The number of del.icio.us bookmarks for older posts does not get updated it seems, so I get almost twice as many on some. In the case of one more than 80 instead of 40.
When I click on the Google icon I get to an unstyled XML page which is very difficult to read…
For SEO blogs Digg is not needed (Digg boycotts SEO), so I’d rather would like to customize which services I want to monitor. Personally I’d prefer Mixx instead.
Also a widget would be grand, one where you can display your current stats and can make you visitors vote at the same time.
:-)
I’m more than willing to listen — it’s the most interesting part of my job! :)
Thanks for the info, definitely handy in metrics-tweaking discussions. (The goal is, of course, to constantly improve the algorithms.)
We’re also currently in discussions on sites/apps to potentially add to the mix (no pun intended), so user feedback is certainly welcome.
I like the combined function widget idea. I’ve definitely noticed so far that some of the best commentary comes when people compare the “machine” rankings to what other humans think. Of course, I’m not the one who has to code it, but if enough people ask for stuff like that, then I have a big stick to use with the developers. :)
I’m sure we’ll chat again.
[…] Top 3 Web Tools to Find Out How a Blog Performs Over Time “Why would you want to find out how a blog performs over time? Either it’s your blog, you want to buy a blog or you want to find out how another blogger made it and when. Last but not least for SEO reasons you always want to find out more about other blogs.” […]
[…] Top 3 tools to find out how a blog performs over time […]
Just discovered your blog with tons of great advices and discoveries like these tools ! I will follow you for sure now ! Great blog !
i never knew about these tool so ill definatly use them for my 32 day old blog, thank you
Very useful post. I was not aware of these tools. Will check them out in detail. Thanks.